User Guide - Welcome!
This User Guide provides comprehensive instructions and explanations for using BN Modeller. Whether you’re a novice or an experienced Bayesian network modeler, this guide will help you leverage the software’s features to build, analyze, and visualize your networks.
Table of Contents
Getting Started
Installation BN Modeller
1. Installation via pip (Recommended for Python Users)
If you have Python installed on your system, we recommend using pip, the Python package installer, to install BN Modeller.
- Prerequisites: Ensure you have Python 3.7 or higher installed. You can download Python from https://www.python.org/downloads/.
-
Installation Command: Open your terminal or command prompt and run the following command:
pip install bn-modeller -
Verification: After the installation completes, you can verify that BN Modeller is installed correctly by running the following command in your terminal:
bn_modeller --version
2. Installation using the Windows Executable**
For users who prefer not to use Python or are on Windows, a pre-built executable file is available.
- Download: You can download the latest Windows executable from the BN Modeller GitHub Releases page.
- Installation: There is no installation process; simply download and run the
.exefile. - Note: The executable includes all necessary dependencies and does not require a separate Python installation.
Launching BN Modeller
- Windows, exe-based distribution: Double-click the BN Modeller executable file.
- Python-based distribution (e.g., using pip): Open a terminal or command prompt and run:
bn_modeller
Understanding the Interface and workflow
When you launch BN Modeller, you’ll be greeted with a dialog box that guides you through the initial setup. From there, the application presents a series of interconnected views, each designed for a specific stage of the Bayesian network creation process. Let’s walk through each of these views.
Navigation: Use the tabs or menu options to navigate between these different pages. Experimentation: Don’s be afraid to experiment with different settings and options to see how they affect the network structure and visualization.
1. Project Selection and Initialization
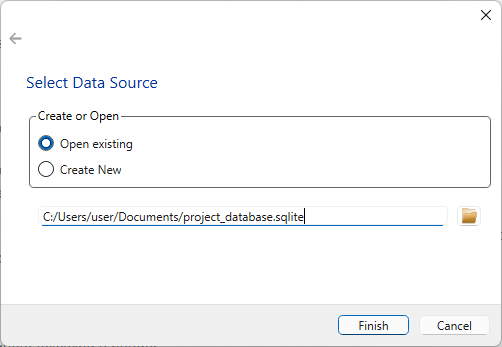
Upon startup, the Project Selection Dialog appears. This dialog allows you to either:
Open an Existing Project: Select a previously saved project from the list. This will load the data and any existing network structure. Create a New Project: Choose this option to start a new project from scratch. You’ll be prompted to specify a project name and location.
Detailed instructions on how to use this dialog are provided on the page Project Selection.
2. Evaluation of Variables Correlation
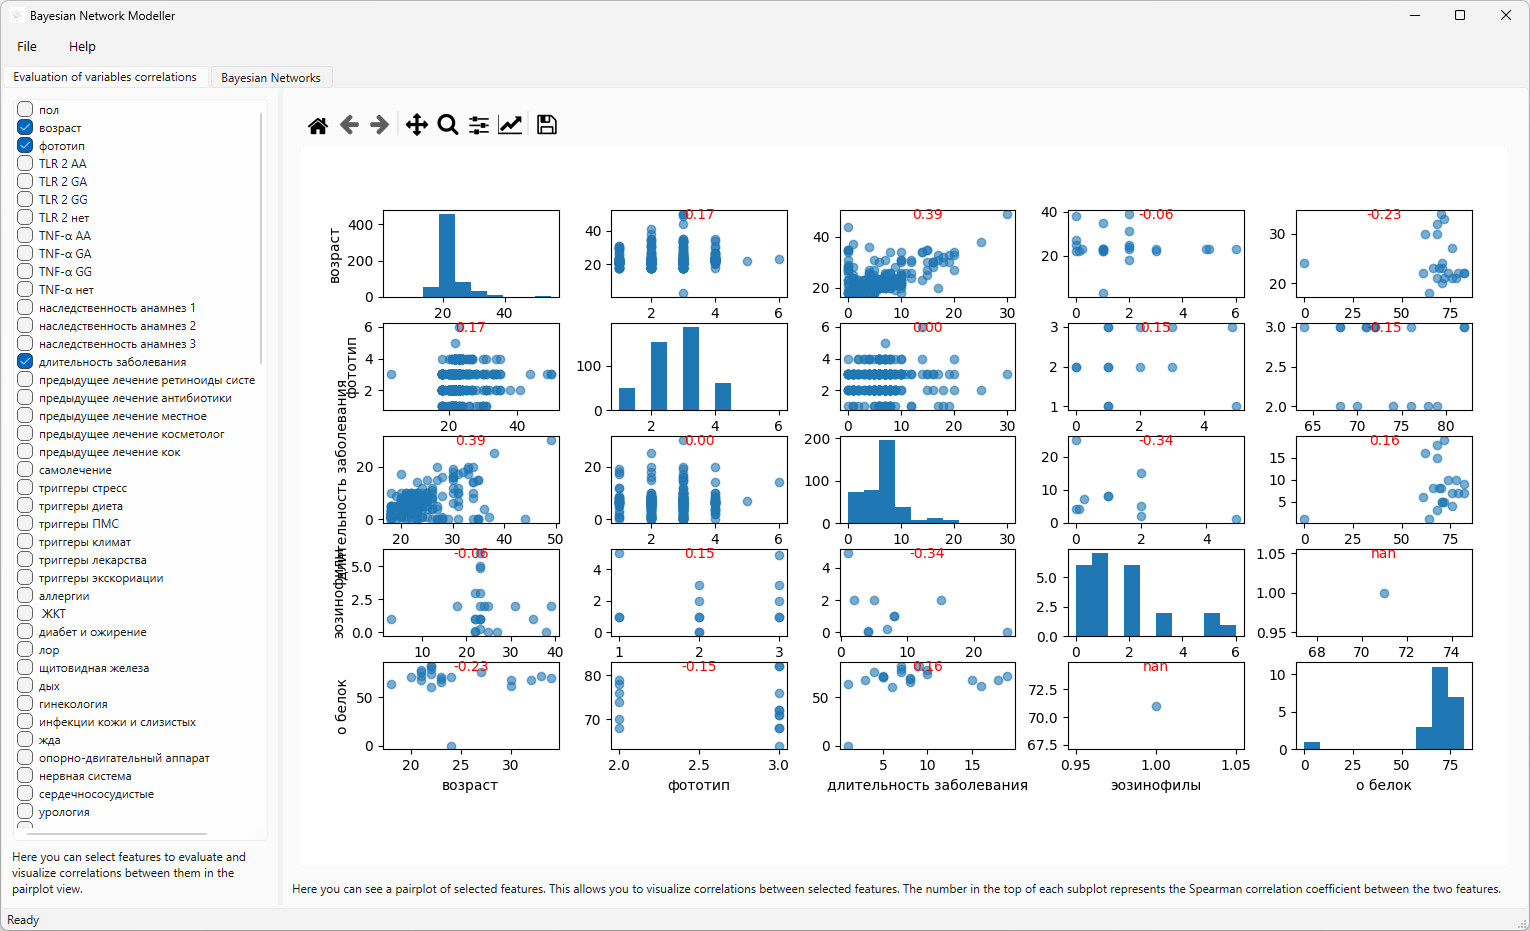
After selecting or creating a project and importing data, you’ll be taken to the Pair-wise Correlation Evaluation page. This page provides a visual assessment of the relationships between your variables.
Variable selection: You can select which variables to include in the evaluation by checking the corresponding boxes. This allows you to focus on specific relationships without cluttering the view with unnecessary data. Note: this selection does not affect the actual data used in the analysis; it only controls which variables are displayed on this page.
Pair-Plots: This page displays a grid of pair-plots. Each plot shows the relationship between two variables using scatter plots. This allows you to visually identify potential dependencies. The screenshot abowe illustrates an example of this view. Each small dot represents a single data point for the two variables being compared.
Interpretation: Examine the plots for patterns and trends. Strong correlations (linear or non-linear) will appear as clusters or clear trends in the dots. For example, if the dots generally move upwards and to the right, it suggests a positive correlation. Conversely, a downward trend indicates a negative correlation. The absence of a clear pattern suggests a weak or no correlation.
3. Bayesian Network Page
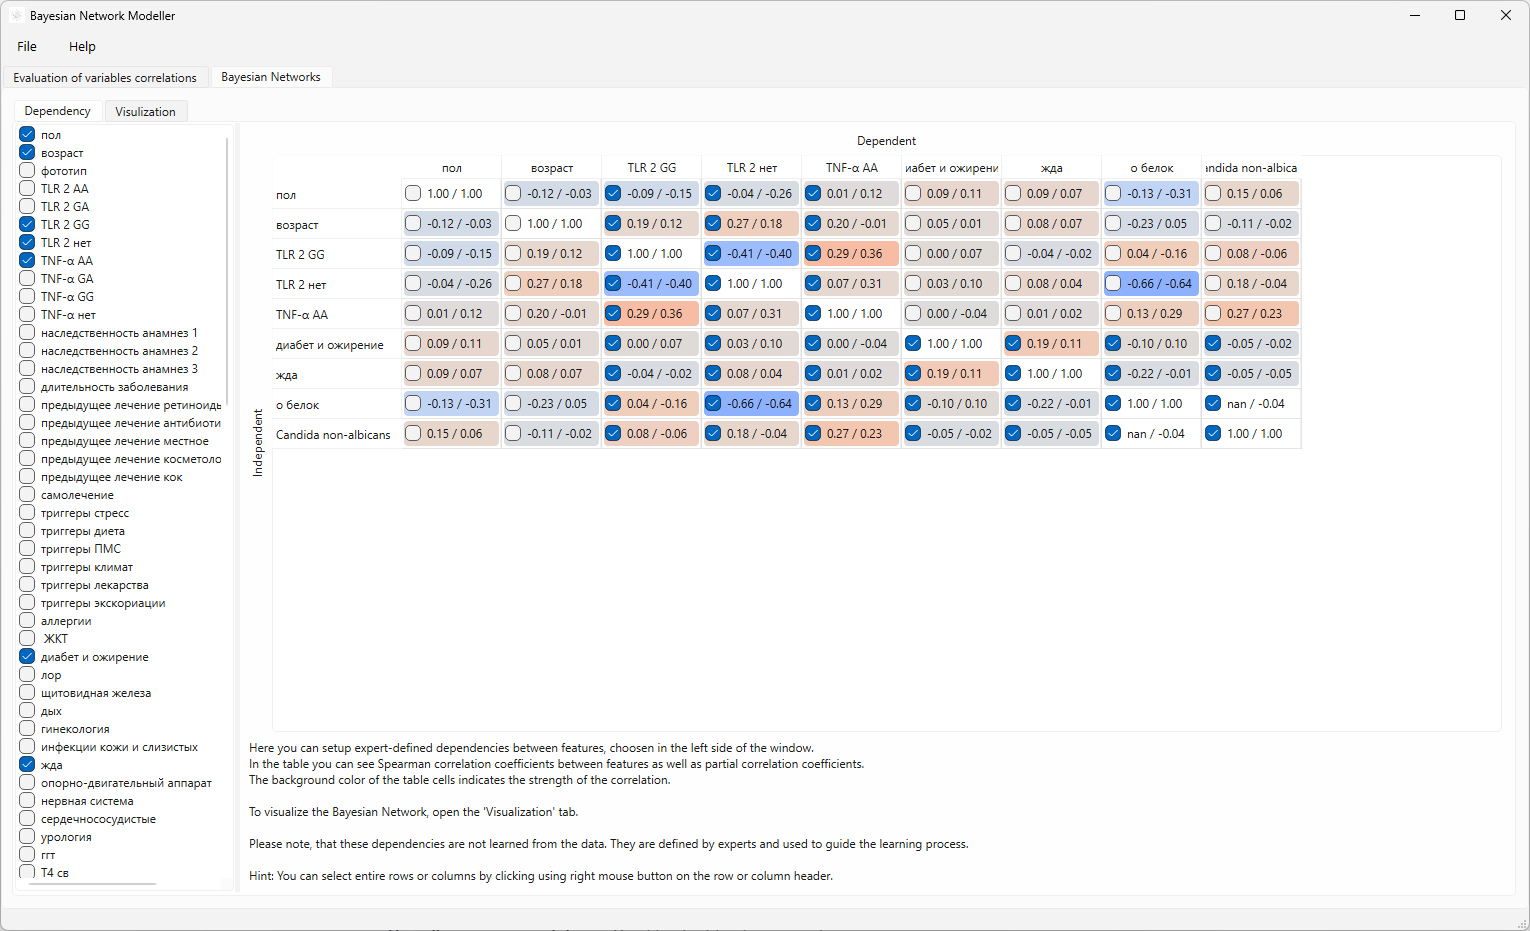
The Bayesian Network page is the core of the network construction process. This page allows you to define the structure of your Bayesian network.
The interface is organized into a grid-like structure, primarily displaying a correlation matrix. It’s designed to allow for a visual assessment of relationships between variables.
Key Sections & Elements:
Variable Selection (Left Side). There is a list of variables. These lists likely allow the user to select a variable to use in Bayesian Network construction.
Correlation Matrix (Central Area).
- Rows & Columns: The core of the interface. Each row and column represents a variable in the dataset.
- Cells: Each cell within the matrix displays a correlation coefficient between two variables. The value indicates the Pearson and Partial correlation oefficients. By checking a box, you are indicating that the variable on the column and is dependent on the variable on the raw. This creates a directed edge in your Bayesian network. Checkboxes allow you to manually specify dependencies based on expert knowledge.
- Color Coding: The cells are color-coded. This uses a gradient (e.g., blue for positive correlation, red for negative correlation, white/neutral for weak r no correlation). This visual cue helps quickly identify strong correlations.
- Variable Labels: The rows and columns are labeled with the names of the variables.
4. Bayesian Network Visualization Page
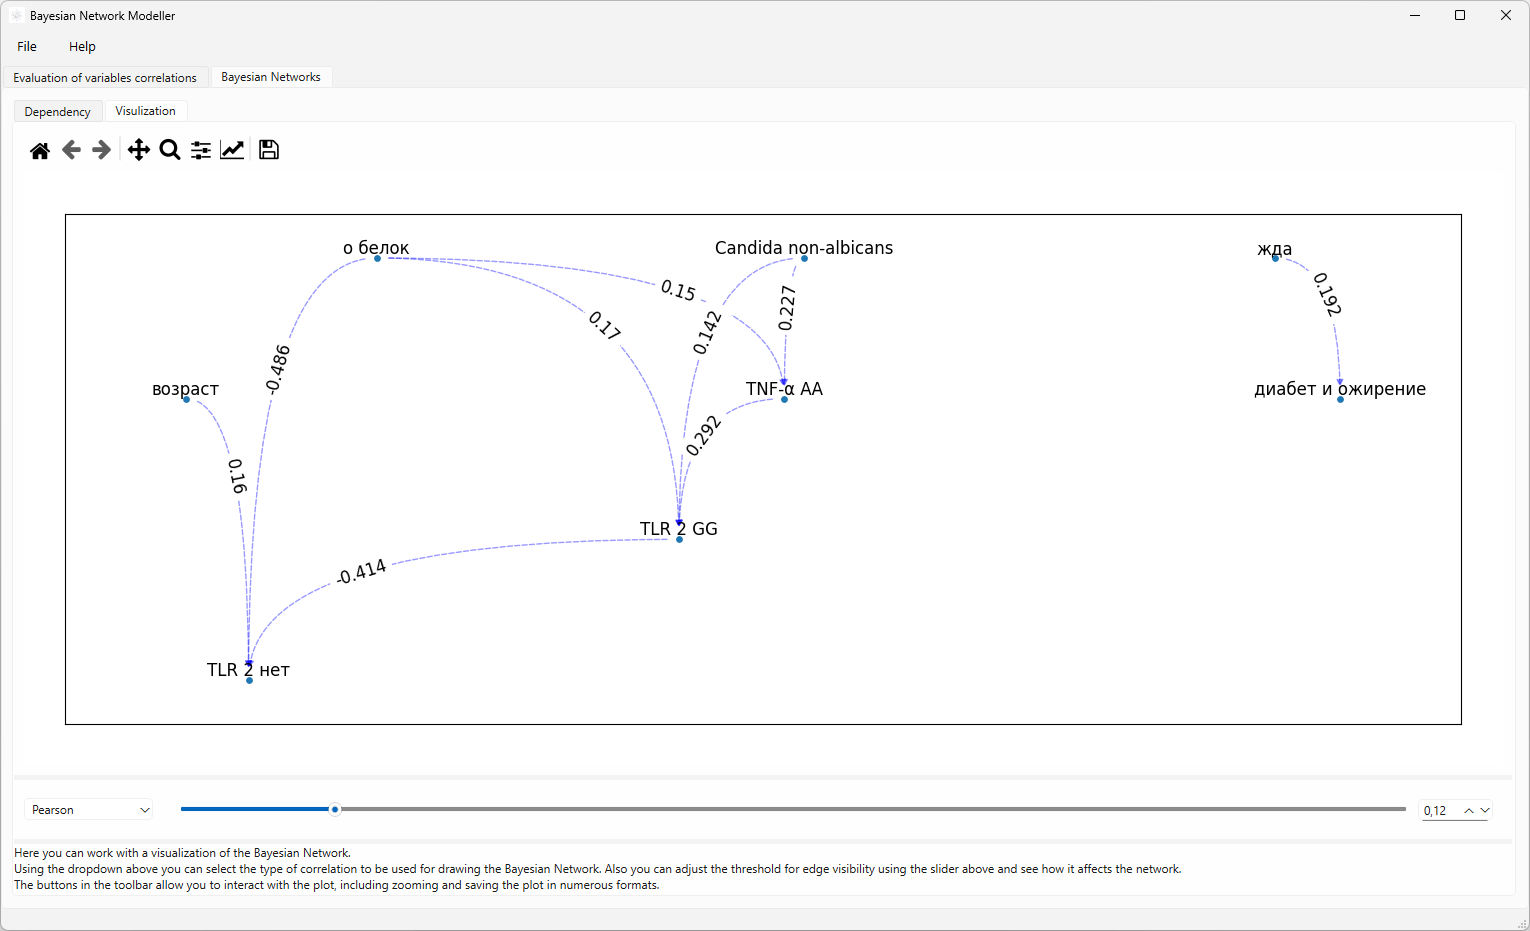
The Bayesian Network Visualization page provides a graphical representation of your network.
Visualization Toolbar:
- Zoom Controls: Buttons for zooming in and out of the network.
- Pan Controls: Buttons for panning (moving) the view of the network.
- Bayesian Network visualization export button: Allows you to export the current view of the Bayesian Network as an image or other format.
Network Graph: The main area of the page displays the Bayesian network as a graph, with nodes representing variables and edges representing dependencies.
Correlation Selection: You can select which type of correlation is used to construct the network. Options may include:
- Pearson’s Correlation
- Spearman’s Rank Correlation
- Partial Correlation
Threshold Adjustment: A slider or input field allows you to adjust the threshold for edge visualization. This controls which dependencies are displayed as edges in the network graph. Lower thresholds show more edges, while higher thresholds show fewer edges.
Troubleshooting
TBD
Frequently Asked Questions (FAQ)
TBD