Data Analysis Workflow
After loading your data into BN Modeller, you can proceed with data analysis and model building. This section outlines the steps involved in this process.
Step 1: Evaluating Variable Correlations
Before proceeding to model building, it’s important to evaluate the correlations between variables. This helps you understand how different variables interact and can guide the selection of relevant variables for the model.
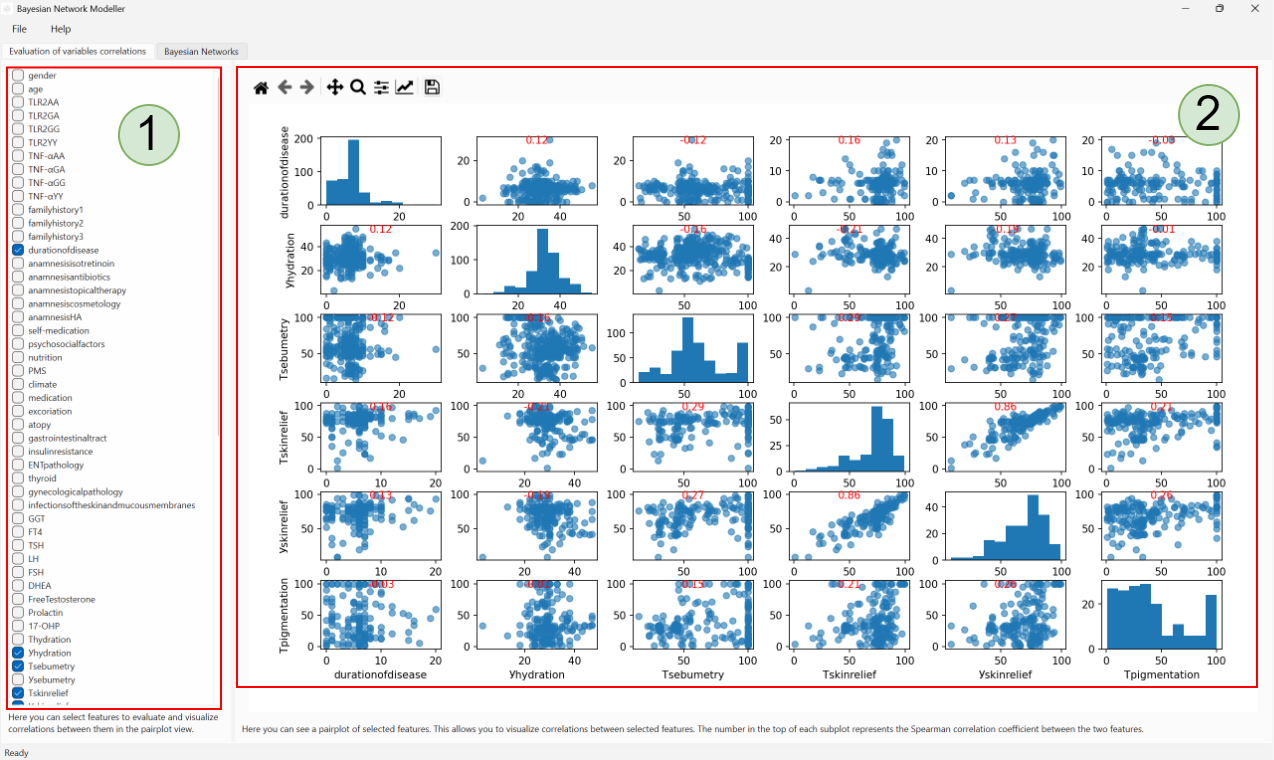
The figure above shows an example of the Pair-wise Correlation Evaluation page. This page provides a visual assessment of the relationships between your variables.
Area #1 contains a checkbox list for selecting which variables to include in the evaluation. You can select multiple variables by checking their corresponding boxes. This allows you to focus on specific relationships without cluttering the view with unnecessary data. Note: this selection does not affect the actual data used in the analysis; it only controls which variables are displayed on this page.
Area #2 displays a grid of pair-plots. Each plot shows the relationship between two variables using scatter plots. This allows you to visually identify potential dependencies. The screenshot above illustrates an example of this view. Each small dot represents a single data point for the two variables being compared. The plots on the diagonal are histograms showing the distribution of each variable.
You can return to this page at any time by clicking the corresponding tab in the application.
Step 2: Selecting Relevant Variables and Their Relationships
After evaluating the correlations, you may want to select a subset of variables that are most relevant for your analysis. This is performed in the “Bayesian Network -> Dependencies” tab.
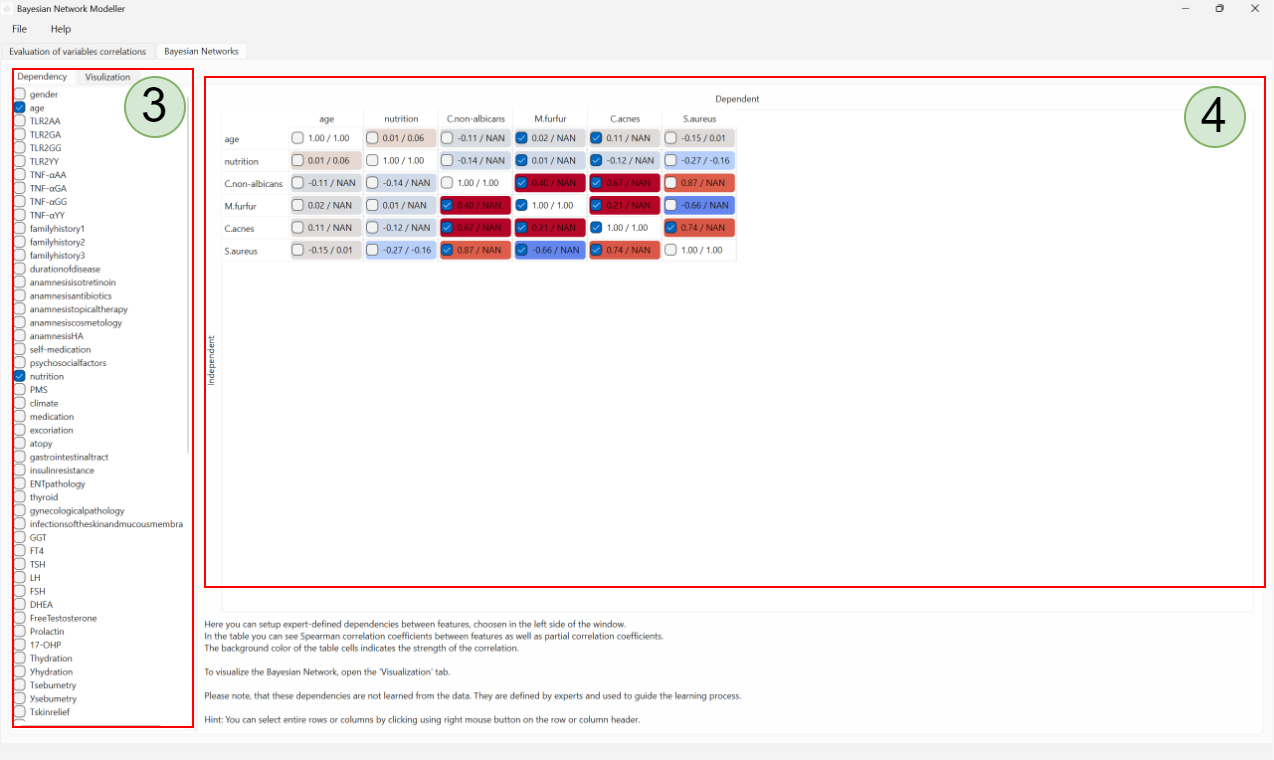
The figure above shows the window where you can select which variables are relevant for your analysis. You can also see a list of all available variables and their relationships with other variables.
The selection process involves checking the boxes next to the variable names in the list on the left-hand side of the screen (Area #3). Once you have selected your relevant variables, the table on the right-hand side (Area #4) will update to show only the relationships between the selected variables.
Dependencies are defined by the expert using checkboxes in the right-hand side table (Area #4). These dependencies are then used to construct the Bayesian Network structure. The selected checkboxes represent the conditional probabilities that the variable in the column is dependent on the variable in the row.
Step 3: Constructing the Bayesian Network Structure
After selecting the relevant variables and their relationships, you can proceed to construct the Bayesian Network structure. This step involves creating a graphical representation of the dependencies between the selected variables. The graphical representation helps in understanding the conditional probabilities and how they affect each other.
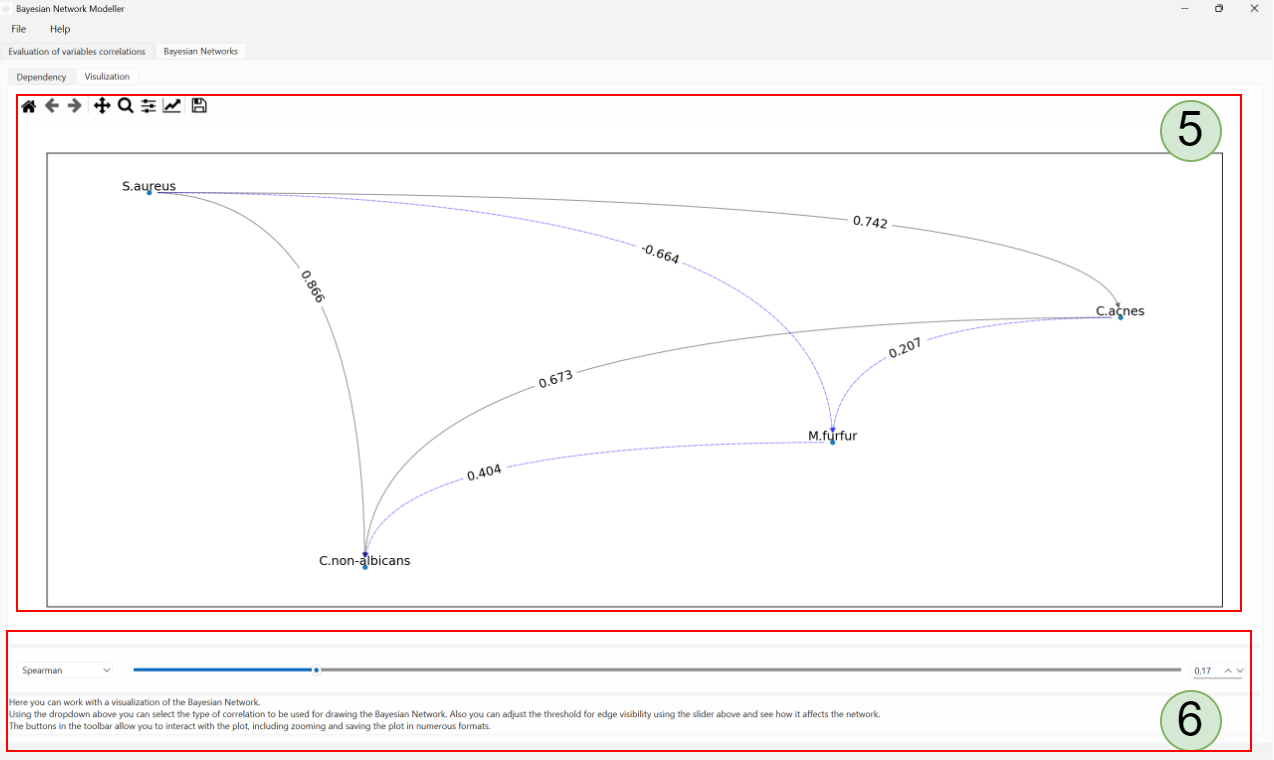
To construct the Bayesian Network structure, open the Bayesian Network -> Visualization tab. Here, you will see a canvas (Area #5) with Bayesian Network nodes and edges.
Using the tools in Area #6, you can select the type of correlation matrix used to evaluate the variables’ correlation. You can also adjust the threshold for the correlation matrix to filter out weak correlations. The visualization will update automatically based on your selection.
Once you have constructed the Bayesian Network structure, you can save it as a file or export it for further analysis.